The Raspberry Pi Pico Explorer is a plug-in board that provides a number of built-in devices including a 240x240 colour display, four buttons, a piezo buzzer, two I2S Breakout Garden sockets and sockets connected to the Pico's pins plus a small solderless breadboard.
A Raspberry Pi Pico with pre-soldered headers makes development easy without needing to solder delicate electronics.


Updating the Firmware
To use the components on the Explorer board, Pimoroni has created a custom UF2 file, including the required drivers. As of 03/01/2022 the latest version of the Pimoroni firmware (0.3.2) does not work, use version 0.3.1. This might not be the case for other boards.
Use the Update Firmware option on Thonny to return to a vanilla flavour and the Blink example if the current Pimoroni version does not work as expected. Select an earlier version of the UF2 and try again.

There is an example that measures the cpu temperature which is then displayed as text and a bar graph.

To provide some measurements, a BME680 environmental sensor was added to the right hand socket. In the left hand socket is a rotary encoder with a built in RGB LED.
 The two sockets allow the addition of two breakouts. PIMORONI have a range of breakouts, including additional convertors that allow connection to STEMMA or Qwiic devices.
The BME680 breakout is an older model, the current version includes a built in STEMMA or Qwiic connector.
 The example program was modified to get the temperature, pressure and humidity from the BME680 sensor plus the cpi temperature.

 The code to set the encoder's RGB LED colour was also added.
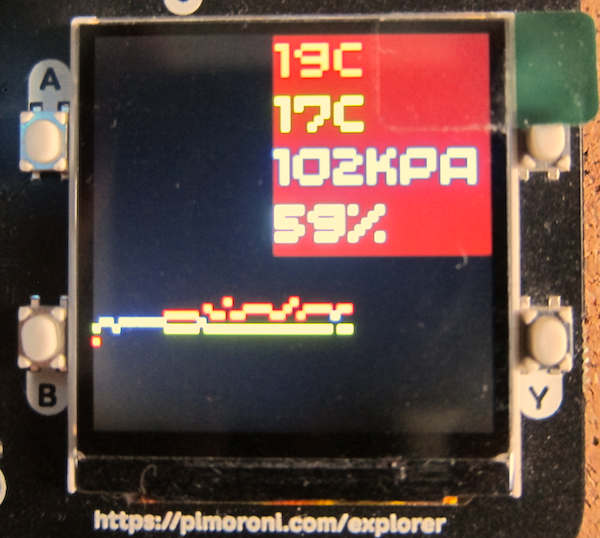 The graph code was designed to display both the cpu temperature and the sensor temperature.
Finally a maximum and minimum sensor temperature was added to the display.


Code
Do check the indenting as Python uses the indenting to define the structure of the program.
import machine
import utime
from breakout_bme68x import BreakoutBME68X
from pimoroni_i2c import PimoroniI2C
PINS_BREAKOUT_GARDEN = {"sda": 4, "scl": 5}
PINS_PICO_EXPLORER = {"sda": 20, "scl": 21}
i2c = PimoroniI2C(**PINS_PICO_EXPLORER)
# Pico Explorer boilerplate
import picoexplorer as display
width = display.get_width()
height = display.get_height()
display_buffer = bytearray(width * height * 2)
display.init(display_buffer)
# BME68x configuration
bme = BreakoutBME68X(i2c)
#bme.configure(FILTER_COEFF_3, STANDBY_TIME_1000_MS, OVERSAMPLING_16X, OVERSAMPLING_2X, OVERSAMPLING_1X)
# reads from Pico's temp sensor and converts it into a more manageable number
sensor_temp = machine.ADC(4)
conversion_factor = 3.3 / (65535)
# Set up text areas
blockHeight = 33
textBlocks = 8
textArea=list()
for x in range(textBlocks):
if(textBlocks>4):
if(x<4):
textArea.append([10,(blockHeight*x)+1,120,blockHeight])
else:
textArea.append([120,(blockHeight*(x-4))+1,120,blockHeight])
else:
textArea.append([120,(blockHeight*x)+1,120,blockHeight])
# Set up background and text pens
background_pen = display.create_pen(0,0,0)
cpu_temp_pen = display.create_pen(255, 64, 64)
bme_temp_pen = display.create_pen(64, 255, 64)
pressure_pen = display.create_pen(64, 64, 255)
humidity_pen = display.create_pen(0, 255, 255)
# Define number of pixels for the graph points
graph_element_size = 1
graph_y_scale = 4
def drawTemp(i,cpu_temp,sensor_temp):
diff = abs((cpu_temp*graph_element_size)-(sensor_temp*graph_element_size))
if(diff<graph_element_size):
display.set_pen(255,255,0)
display.rectangle(i, height - (cpu_temp * graph_y_scale), graph_element_size,graph_element_size)
else:
display.set_pen(cpu_temp_pen)
display.rectangle(i, height - (cpu_temp * graph_y_scale), graph_element_size,graph_element_size)
display.set_pen(bme_temp_pen)
display.rectangle(i, height - (int(sensor_temp) * graph_y_scale), graph_element_size,graph_element_size)
def writeInBlock(text, location, pen, paper, size):
# Draw background to clear display area
display.set_pen(paper)
display.rectangle(location[0],location[1],location[2],location[3])
# Write text in location one pixel left and down
display.set_pen(pen)
display.text(text, location[0]+1,location[1]+1,100,size)
# Initialise run variables
i = 0
count = 0
max_temp = 0
min_temp = 100
while True:
# the following two lines do some maths to convert the number from the temp sensor into celsius
reading = sensor_temp.read_u16() * conversion_factor
temperature = round(27 - (reading - 0.706) / 0.001721)
bmetemp, pressure, humidity, gas_resistance, status, gas_index, meas_index = bme.read()
max_temp=max(max_temp,bmetemp)
min_temp=min(min_temp,bmetemp)
# Clear the display and reset counter if the graph reaches the right hand side
if i >= (width + 1):
i = 0
display.set_pen(0, 0, 0)
display.clear()
# Draw graph element
drawTemp(i,temperature,bmetemp)
writeInBlock("{:.0f}".format(temperature) + "c", textArea[0],cpu_temp_pen,background_pen,4)
writeInBlock("{:.0f}".format(bmetemp) + "c", textArea[1],bme_temp_pen,background_pen,4)
writeInBlock("{:.0f}".format(pressure/1000) + "kPa", textArea[2],pressure_pen,background_pen,3)
writeInBlock("{:.0f}".format(humidity)+"%", textArea[3],humidity_pen,background_pen,4)
writeInBlock("Mx {:.0f}".format(max_temp) + "c", textArea[4],bme_temp_pen,background_pen,3)
writeInBlock("Mn {:.0f}".format(min_temp) + "c", textArea[5],bme_temp_pen,background_pen,3)
# time to update the display
display.update()
# waits for 5 seconds
utime.sleep(1)
# Set next graph element location
i+=graph_element_size


